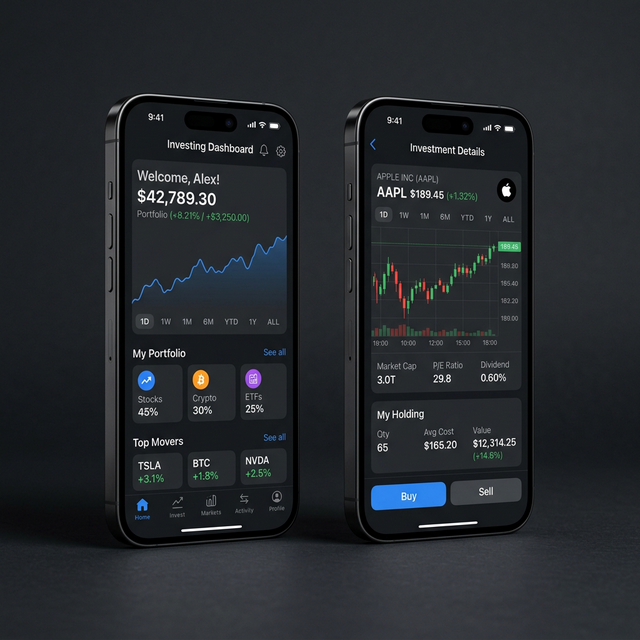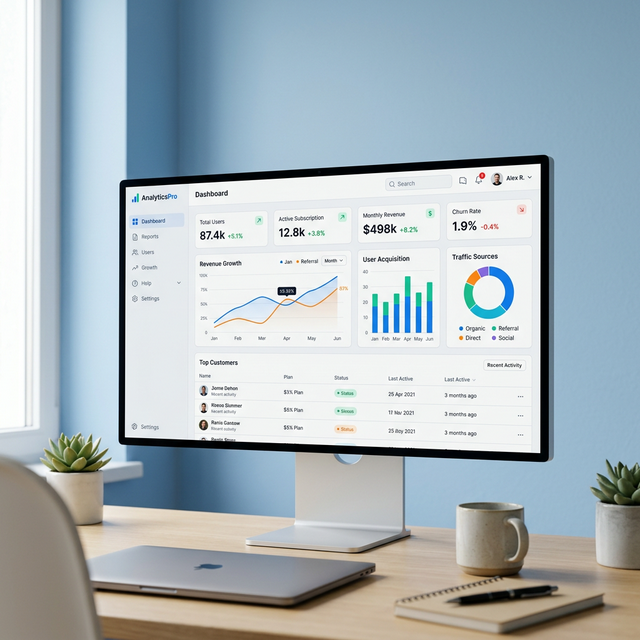
Nova Dashboard
Reimagining B2B SaaS for the modern era
The Challenge
Nova Technologies had a powerful analytics platform — but an interface that felt stuck in 2016. Their B2B SaaS dashboard had accumulated years of feature additions without a cohesive design system. The result was a confusing, sluggish experience that was driving churn despite the underlying product being best-in-class.
They came to us with a clear mandate: rebuild it from the ground up, without losing a single feature.
Our Approach
We began with a three-week discovery phase, interviewing 24 power users across Nova's enterprise clients. The core insight was surprising: users didn't want less complexity — they wanted better navigation of that complexity. The data was all there. The problem was surfacing it intelligently.
// Before: Monolithic data fetch causing 4.2s TTI
const data = await fetchEverything(userId);

// After: Streaming + React Suspense for progressive hydration
async function DashboardPage({ params }: { params: { id: string } }) {
  return (
    <Suspense fallback={<DashboardSkeleton />}>
      <Dashboard id={params.id} />
    </Suspense>
  );
}
Design System
We built a comprehensive design system with 140 components in Figma before writing a single line of production code. The system centered on three principles:
- Density without clutter — information-rich views with clear visual hierarchy
- Motion as feedback — every state change communicated through micro-interactions
- Keyboard-first navigation — power users shouldn't need the mouse
Animation Architecture
The animation layer was built with Framer Motion for component-level transitions and GSAP's ScrollTrigger for data visualisation reveals.
// Custom chart reveal animation
const chartVariants = {
  hidden: { pathLength: 0, opacity: 0 },
  visible: {
    pathLength: 1,
    opacity: 1,
    transition: {
      pathLength: { duration: 1.5, ease: "easeInOut" },
      opacity: { duration: 0.3 }
    }
  }
};
Performance Results
After launch, we measured against the original baseline:
| Metric | Before | After |
|---|---|---|
| Lighthouse Performance | 43 | 97 |
| First Contentful Paint | 4.1s | 0.8s |
| Time to Interactive | 8.2s | 1.4s |
| Bundle Size | 847kb | 210kb |
Outcome
The redesigned Nova dashboard launched to unanimous praise from both the internal team and end-users. Within 90 days of launch, Nova reported a 28% increase in paid plan conversions — attributing it directly to reduced friction in the onboarding flow.
“Relogic transformed our product from a functional tool into something our users genuinely love using. The motion design alone justified the engagement.”